August 15, 2024 · Magati Joel
Automating Data Analysis with Google Apps Script
Learn how a powerful Google Apps Script can transform raw Google Form data into organized, chart-ready summaries automatically.
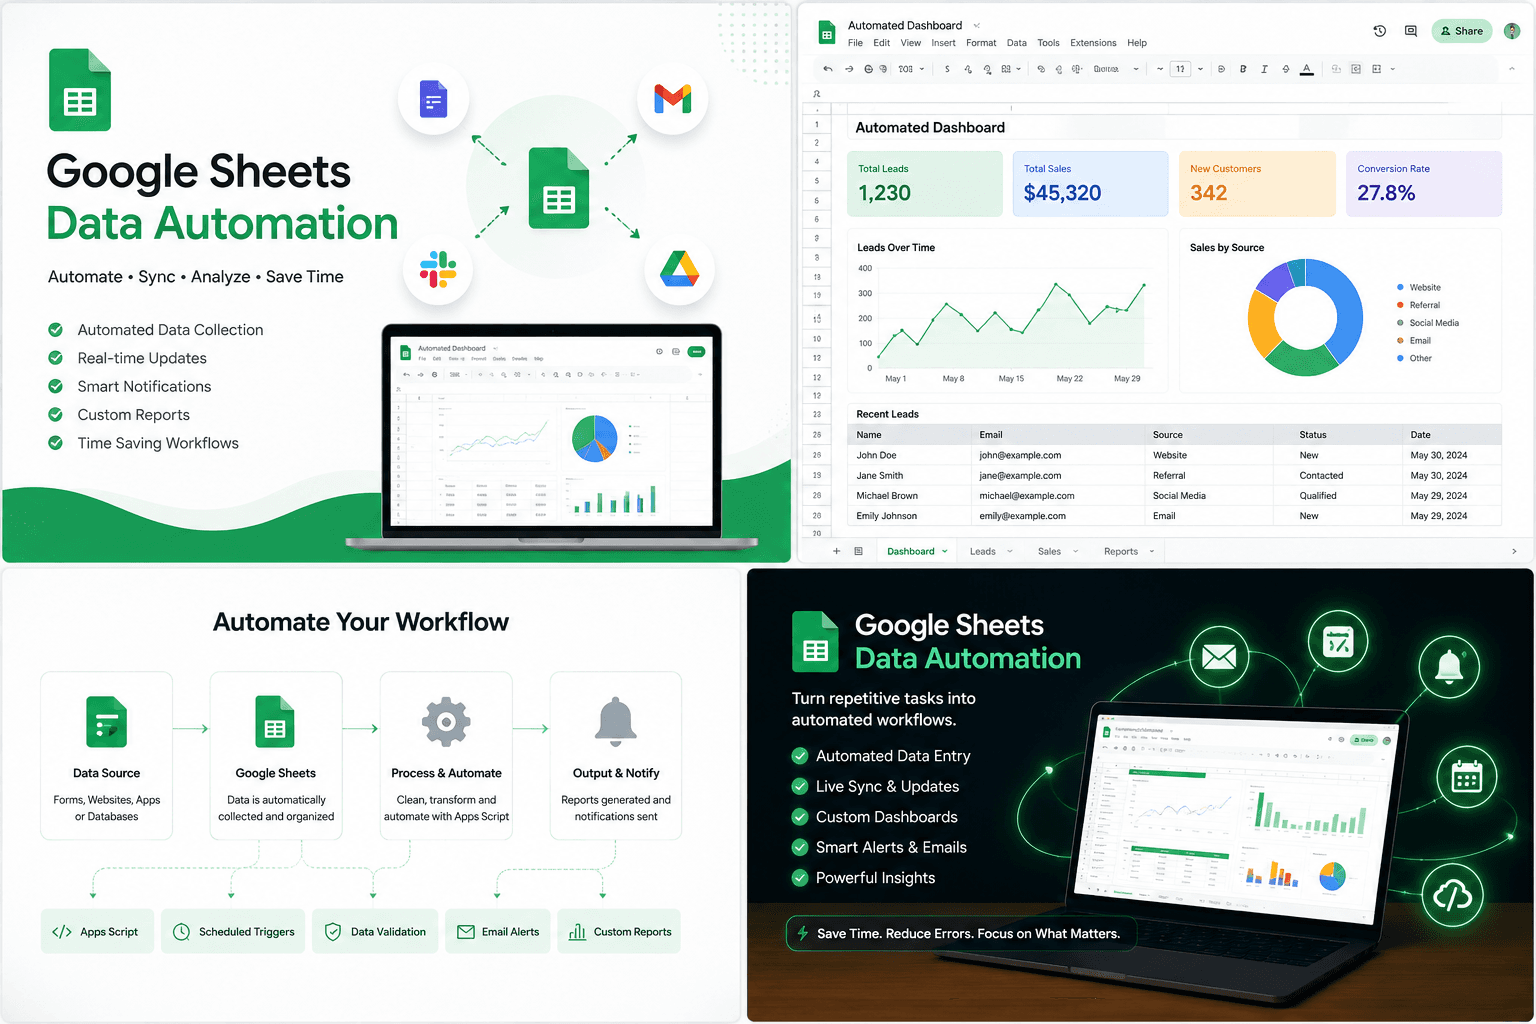
Why This Project Exists
Google Forms makes collecting information easy. The difficult part often begins after the responses arrive.
A spreadsheet filled with raw submissions is technically useful, but it is not always pleasant to read. Long answers stretch across columns, categories become difficult to compare, and creating summaries manually can take hours.
I wanted the spreadsheet to do more than store responses.
I wanted it to organize, summarize, format, and visualize the data automatically.
The Problem
The original workflow relied heavily on manual processing.
Each new form submission added another row, but turning those rows into a useful report required repeated work:
- Rearranging information
- Grouping responses by category
- Formatting cells
- Creating readable summaries
- Calculating totals
- Building charts
- Updating reports after new submissions
The data was available, but the insights were buried inside the raw sheet.
The solution needed to work within Google Workspace so that users could continue using familiar tools without installing additional software.
My Approach
I created a custom Google Apps Script connected to the spreadsheet.
The script reads the Google Form response sheet and generates several presentation-ready views.
One output is a detailed table-style summary with clear headings, category grouping, and color-coded formatting. Another is a card-style summary designed to make individual submissions easier to review.
For numerical responses, the script identifies suitable columns and automatically creates charts grouped by section.
I also added a custom spreadsheet menu so users can run the automation without opening the Apps Script editor.
An installable trigger allows the summary to update whenever a new form response is submitted.
The workflow became:
- A user submits the Google Form.
- The response is stored in Google Sheets.
- The trigger runs the Apps Script.
- Summary sheets are updated.
- Charts reflect the latest data.
Interesting Challenges
Form structures are rarely as consistent as they initially appear.
Some questions contain short text, others contain long paragraphs, and some categories contain numeric values. Empty responses also needed to be handled without creating broken cards or misleading charts.
Another challenge was making the generated output readable.
Automation can produce technically correct spreadsheets that still look terrible. I spent time refining column widths, text wrapping, spacing, section headers, background formatting, and chart placement.
The script also needed to avoid creating duplicate sheets, duplicate charts, or repeated menu items each time it ran.
Idempotency became important: running the automation twice should update the report rather than damage it.
The Tech Stack
The project uses:
- Google Sheets
- Google Forms
- Google Apps Script
- JavaScript
- Spreadsheet triggers
- Google Charts
- Custom spreadsheet menus
Because Apps Script is built into Google Workspace, the entire solution runs without a separate server.
Lessons Learned
Automation is most valuable when it removes work people repeat frequently.
The script does not replace Google Sheets. It makes Google Sheets behave more like a lightweight reporting system.
I also learned that formatting is part of functionality. A report that is visually organized is easier to understand, easier to present, and more likely to be used.
Finally, spreadsheet automation requires careful handling of ranges, headers, empty values, and changing form structures. Small assumptions can easily break when a new question is added.
Final Thoughts
This project transformed a passive spreadsheet into an active reporting tool.
Raw responses now become structured summaries and visual insights with very little manual effort.
What I enjoyed most was solving the problem inside tools people already understood. There was no complex onboarding process and no new application to learn.
Sometimes the best software solution is not a completely new platform. It is a thoughtful layer of automation added to the workflow people already use.